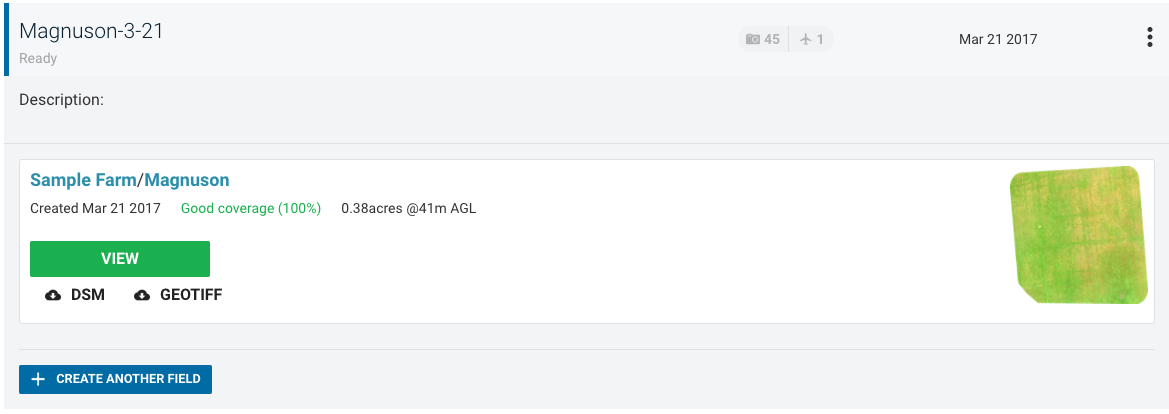
Once you have processed your data in Pix4D and uploaded to Atlas, you can go to the appropriate Farm and view the data on the map instantly, or go to the DataHub tab and click on the View button.
Using the Map
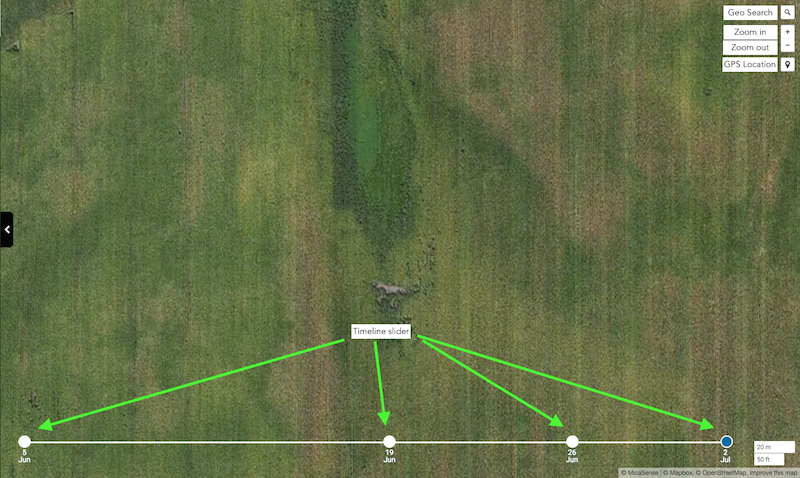
Click and hold to pan around the map. Use the search tool to navigate to coordinates or a particular address. Zoom in and out using your mouse's scroll function or the +/- buttons. The map also works well on touch-enabled mobile devices, so you can pinch to zoom, and touch and drag to pan the map. If you have a GPS-enabled device, you can view your current location in the map by selecting the location button. Your current position will be shown on the map and will update live. If you have captured data for the same field at different dates, use the timeline slider at the bottom of the map to switch between those dates.
Rotate and Tilt the Map
Now you can use the right-click button (ctrl+click on Mac) on your mouse, or two fingers on touch devices to tilt the map view, or rotate it 360º.

Using the Layer Panel
You can open and close the layer panel by pressing the black and white arrow tab on the left side of the map. You can turn layers off or on using the checkbox next to the layer name. The arrow to the right of the layer name hides and shows the histogram, color palette, and other layer options.

You can download full-resolution versions of the outputs in GeoTIFF format, which can be opened in standard GIS applications. To access these files, press the "Export" button, and choose the GeoTIFF or DSM links to download and save the files to a local drive.

You can also reorder layers by selecting the three-line "list" icon (located to the left of the layer name) and performing a drag-and-drop as shown below:

Using the Color Palette and Histogram
As you adjust the color palette and histogram slider, the changes will appear immediately on the map. Click on one of the color palettes to select the gradient of your choice. Set the display range by sliding the histogram minimum and maximum buttons to the desired location. For precision adjustment, you can click on either the min or max of the slider and use the arrow keys on your keyboard to move the value 0.01 to the left or right.
Min & Max
You can also enable transparency for values beyond the minimum and maximum range.
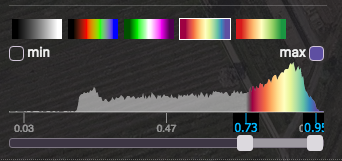
The "min" checkbox is deselected, enabling transparency for all pixels with values smaller than 0.73. You can use this feature to remove unwanted elements from your view (like soil or roads), and focus on the vegetation or other interesting features.
Field Notes

Now you can annotate your fields with points, lines, and shapes. You can write a custom note for each feature you add and can even attach images.

Click on an image to enlarge:

Atlas Keeps State
As you view and use Atlas, it will keep track of the changes you make and remember them later, even if you close your browser window, or logout and log back in again. It will remember your histogram settings, color palette, current view, and other settings.
Next Steps
Now that you are familiar with the basics of Atlas, take a look at these Best Practices for Collecting Data with MicaSense Sensors. This guide contains essential knowledge for collecting good data with your multispectral sensor which will be easy to process and produce good results.